# Visualization-tool
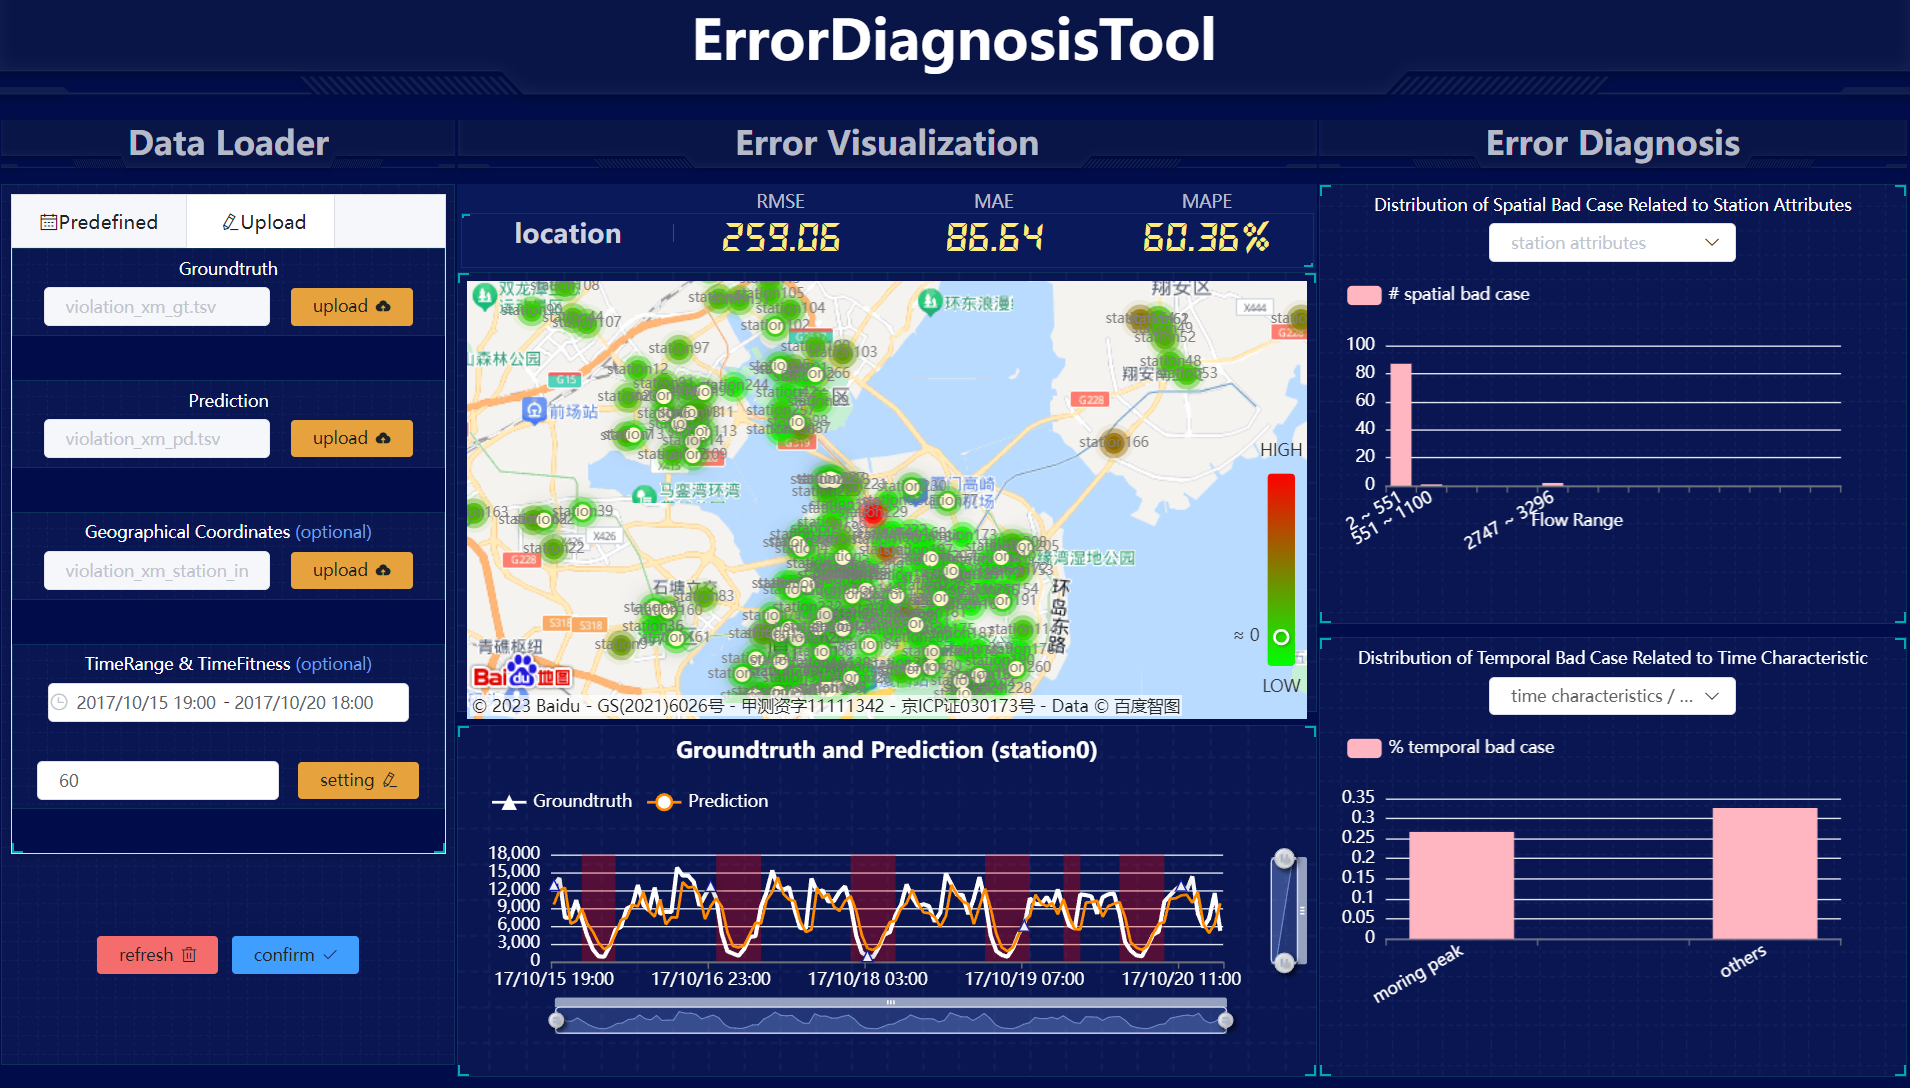
We have developed a tool that integrates visualization, error localization, and error diagnosis. Specifically, it allows data to be uploaded and provides interactive visual charts to show model errors, combined with spatiotemporal knowledge for error diagnosis. Welcome to visit the [website](http://39.107.116.221/) for a trial.
## Quick Start
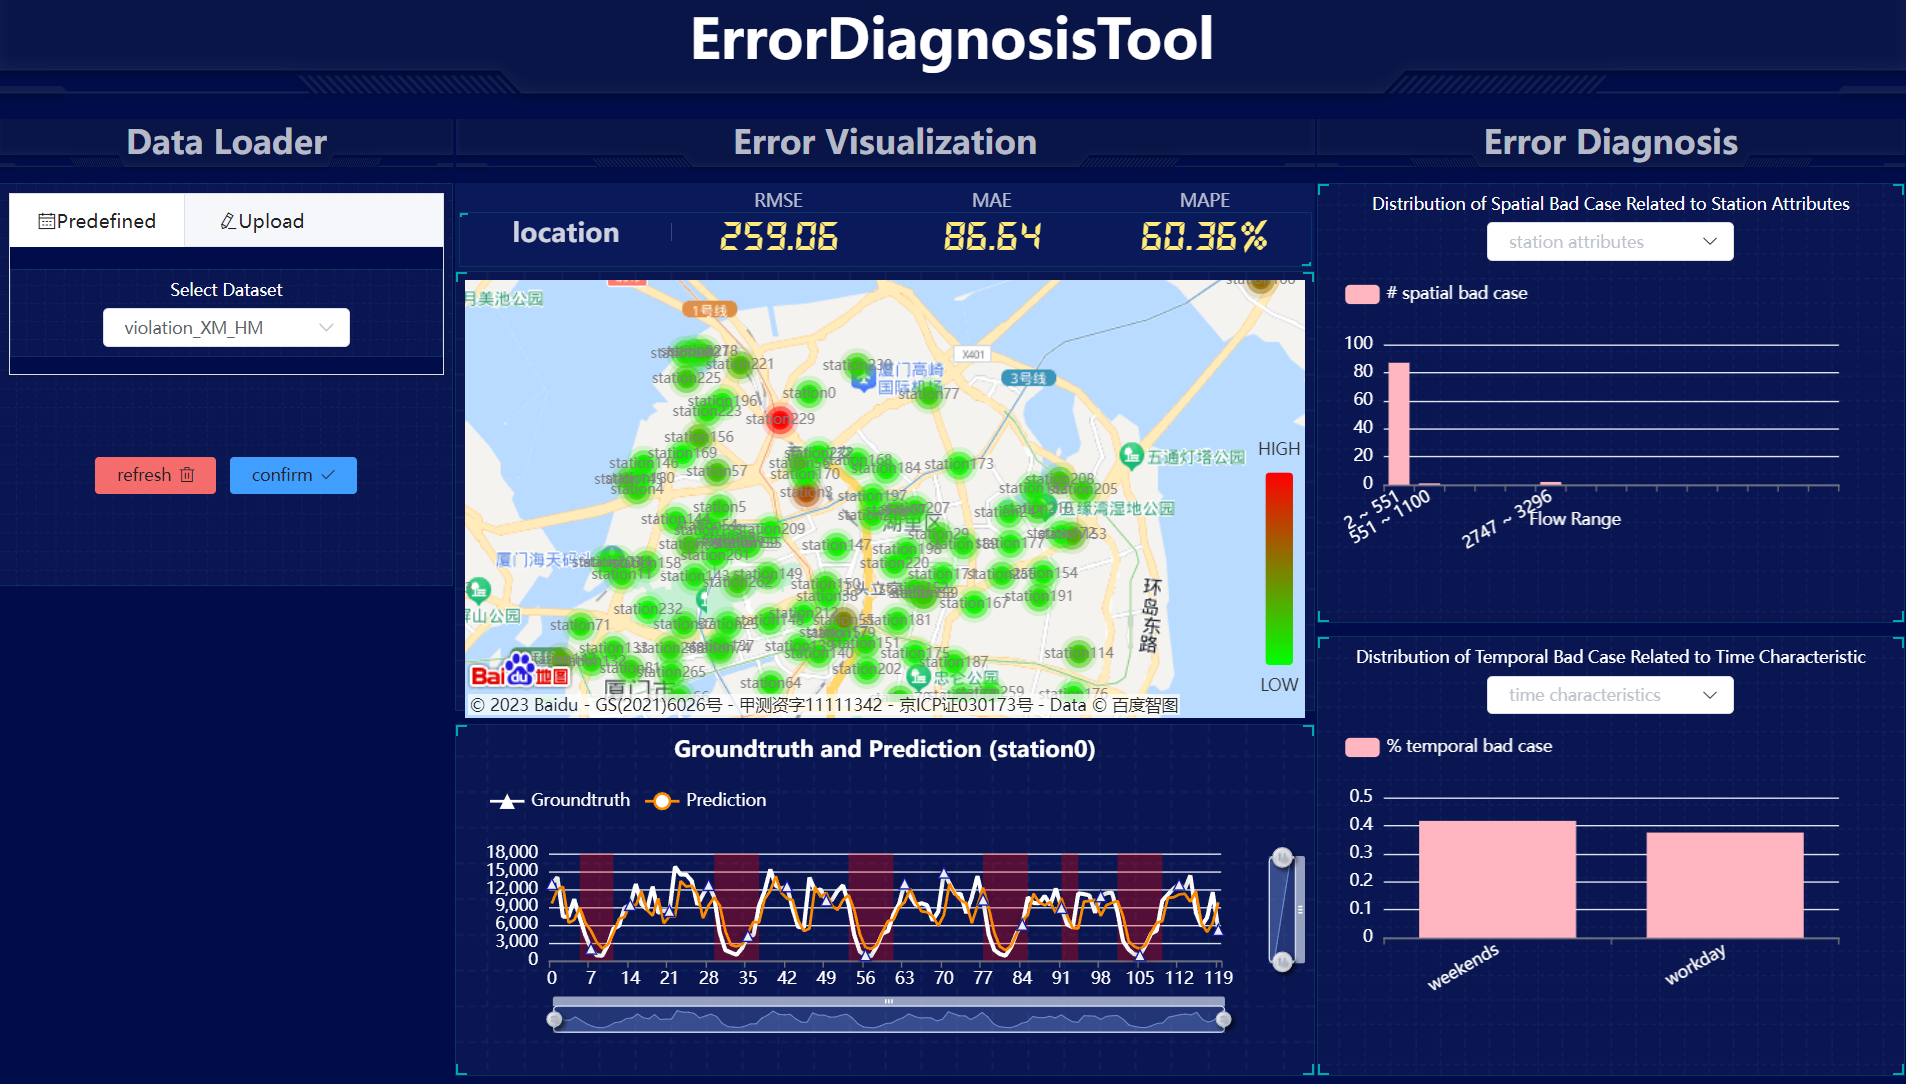
### Start with predefined dataset
You can click on the dropdown menu in the `predefined` module of the `Data Loader`, select the dataset you need, and click `confirm` to obtain the required diagnosis and visualization.
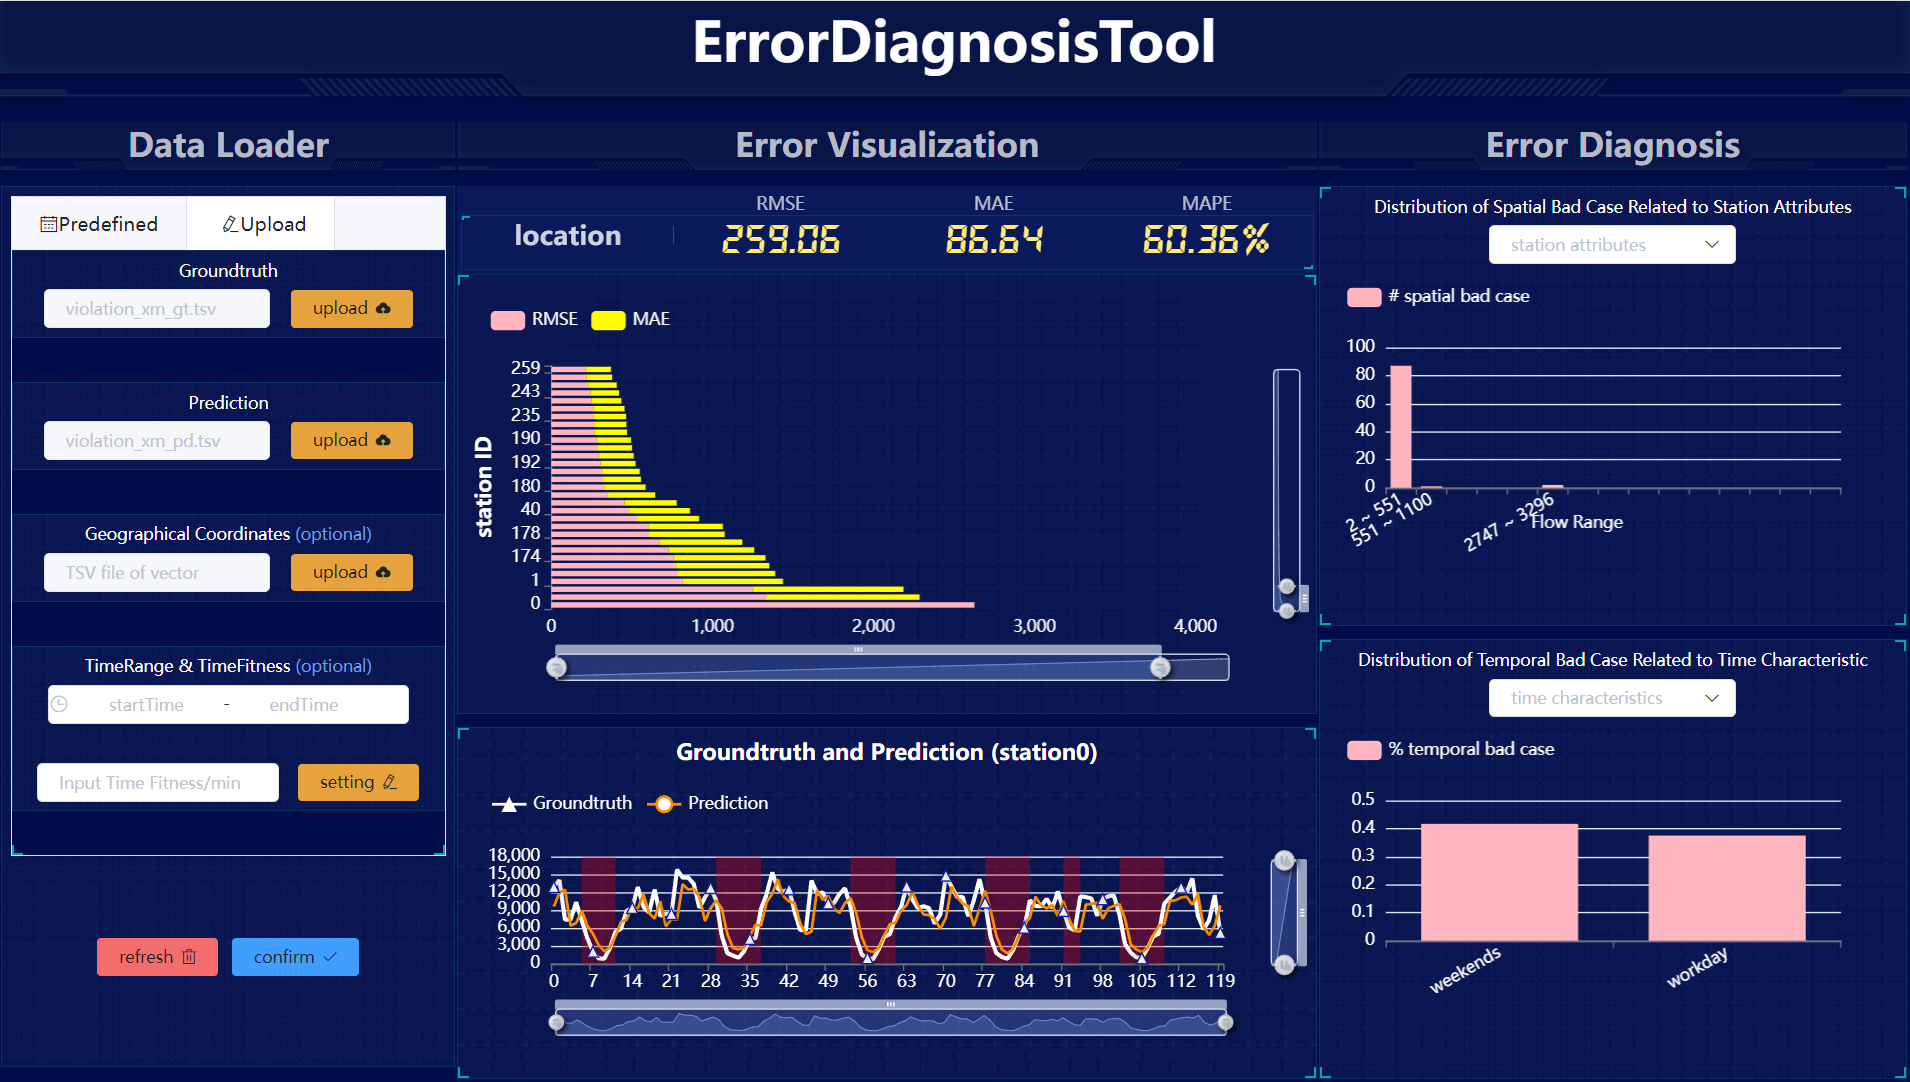
 ### Start with prediction and ground truth
You can upload specifically formatted TSV files for prediction and ground truth in the `upload` module of the Data Loader. Clicking `confirm` will enable you to obtain the corresponding diagnosis and visualization.
### Start with prediction and ground truth
You can upload specifically formatted TSV files for prediction and ground truth in the `upload` module of the Data Loader. Clicking `confirm` will enable you to obtain the corresponding diagnosis and visualization.
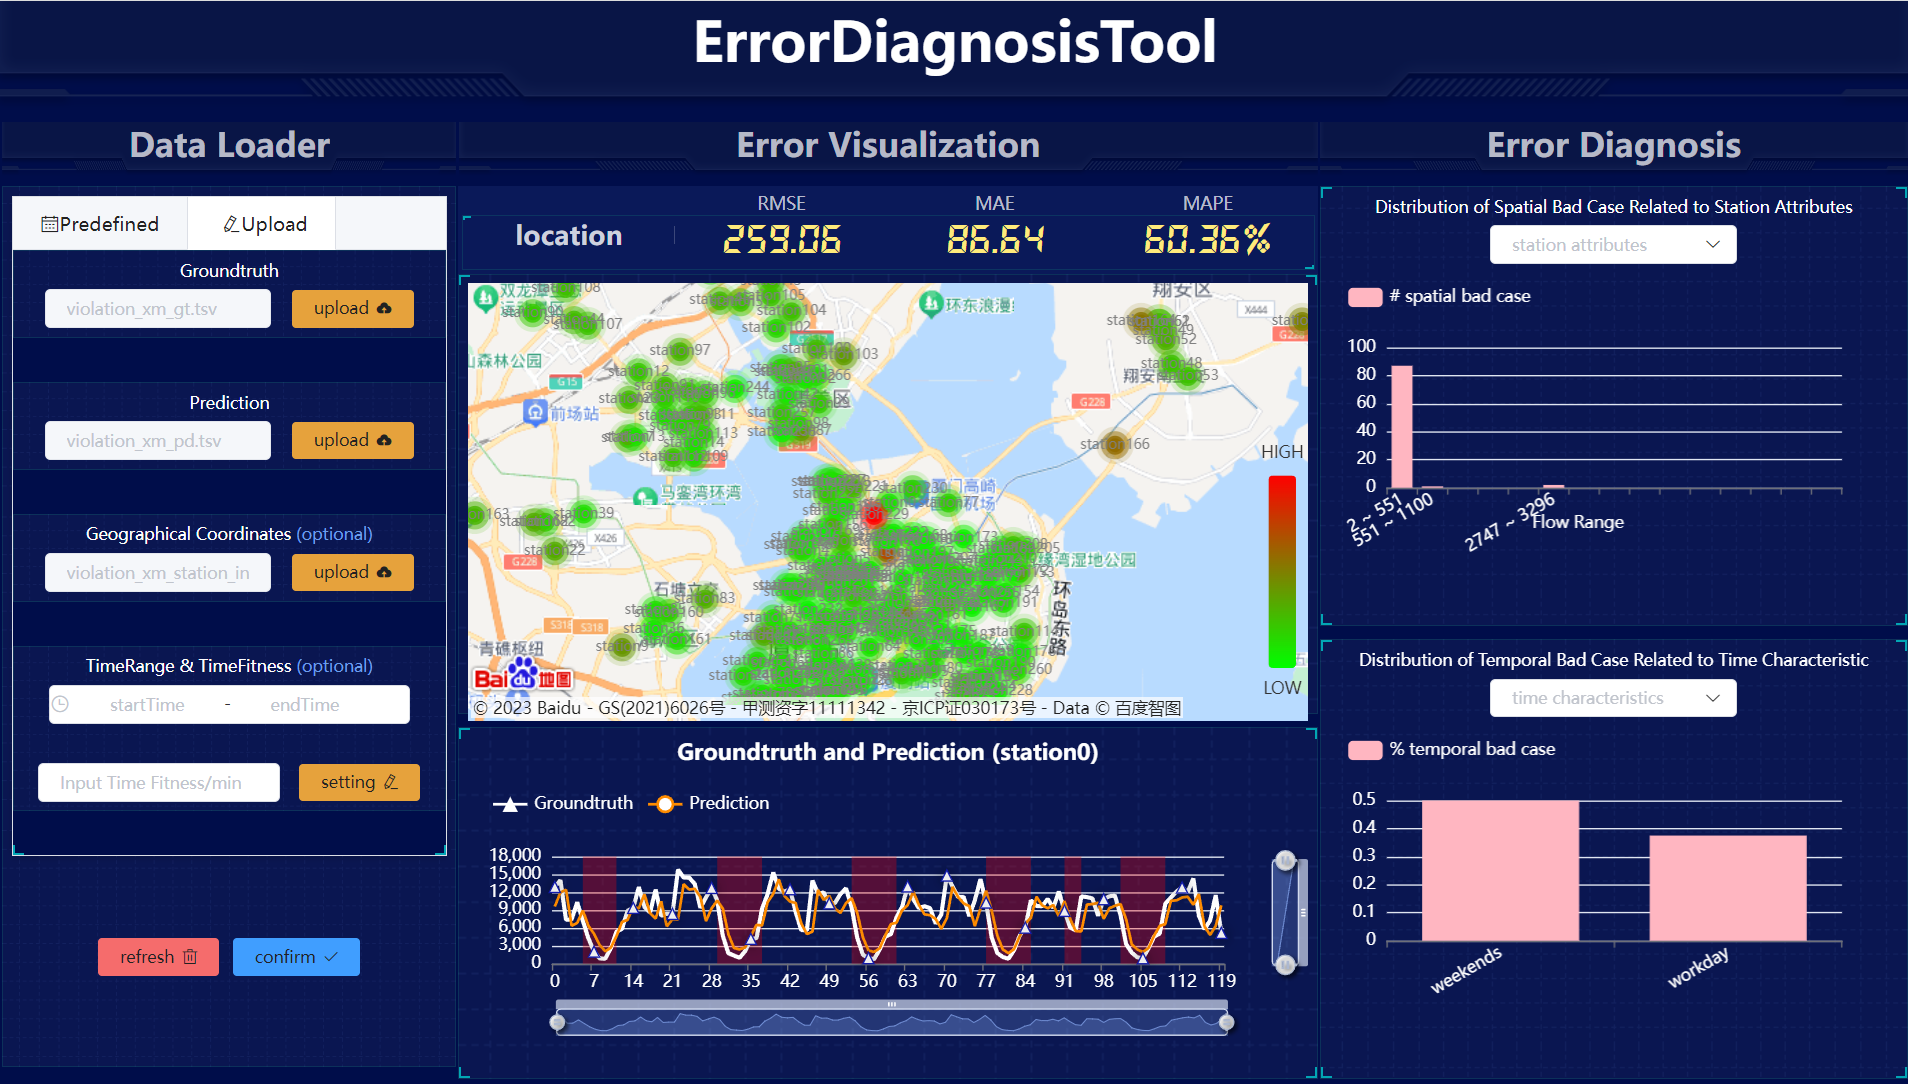
 ### Start with prediction, ground truth and spatial information
You can upload specifically formatted TSV files for prediction, ground truth, and spatial information in the `upload` module of the `Data Loader`. Clicking `confirm` will enable you to obtain the corresponding diagnosis and visualization.
### Start with prediction, ground truth and spatial information
You can upload specifically formatted TSV files for prediction, ground truth, and spatial information in the `upload` module of the `Data Loader`. Clicking `confirm` will enable you to obtain the corresponding diagnosis and visualization.
 ### Start with prediction, ground truth and temporal information
You can upload specifically formatted TSV files for prediction, and ground truth in the `upload` module of the 'Data Loader', along with the corresponding temporal information. Clicking `confirm` will enable you to obtain the corresponding diagnosis and visualization.
### Start with prediction, ground truth and temporal information
You can upload specifically formatted TSV files for prediction, and ground truth in the `upload` module of the 'Data Loader', along with the corresponding temporal information. Clicking `confirm` will enable you to obtain the corresponding diagnosis and visualization.
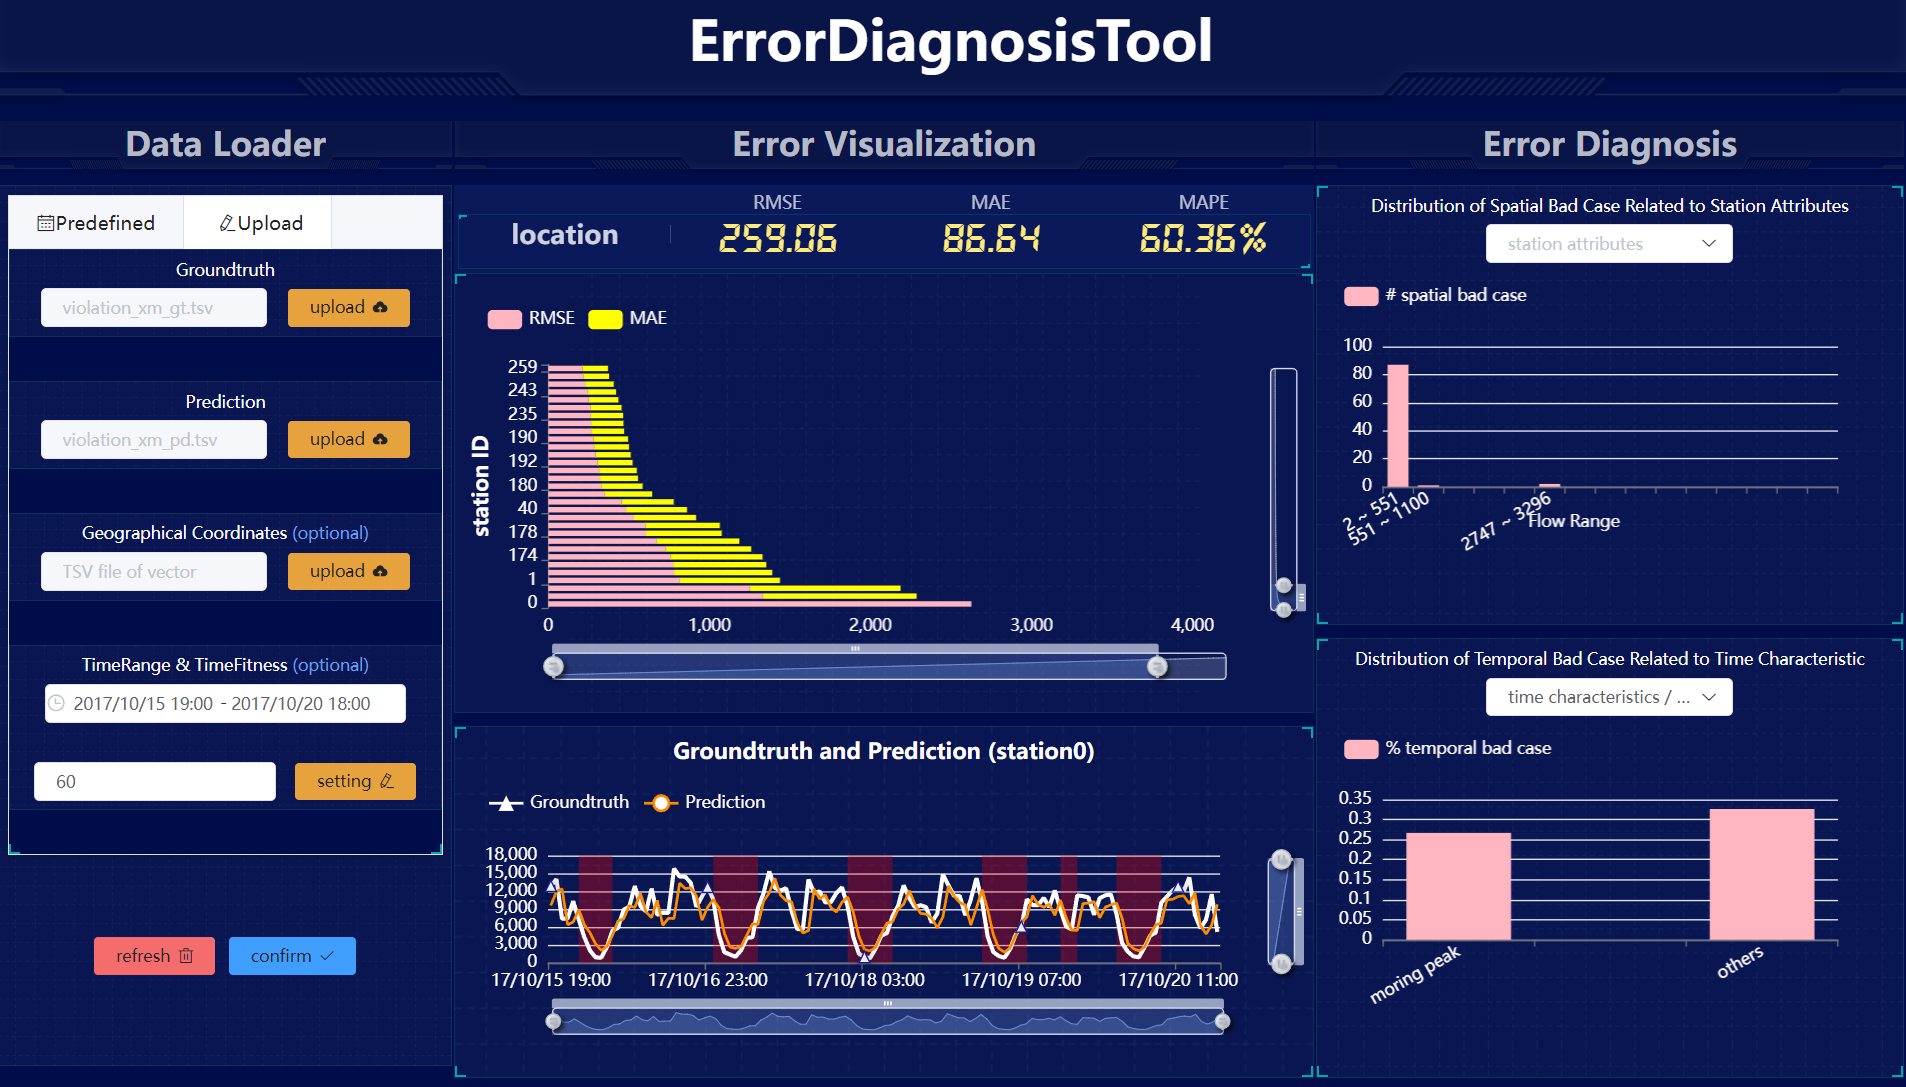 ### Start with prediction, ground truth as well as spatial and temporal information
You can upload specifically formatted TSV files for prediction, ground truth, and spatial information in the `upload` module of the `Data Loader`, along with the corresponding temporal information. Clicking `confirm` will enable you to obtain the corresponding diagnosis and visualization.
### Start with prediction, ground truth as well as spatial and temporal information
You can upload specifically formatted TSV files for prediction, ground truth, and spatial information in the `upload` module of the `Data Loader`, along with the corresponding temporal information. Clicking `confirm` will enable you to obtain the corresponding diagnosis and visualization.
 ## Contribute to our project.
The visualization-tool offers two usage options, which are accessing through the [website](http://39.107.116.221/), or using the source code(for contribution).
**Step 1: Requirements**
```vue
node == 16.14.0
npm == 8.3.1
```
**Step 2: Clone repository and install dependencies**
```Vue
git clone https://github.com/uctb/visualization-tool-UCTB.git
cd visualization-tool-UCTB
npm install
```
**Step 3: Start**
```Vue
npm run serve
```
Then you will see the following prompt on the screen:
```vue
App running at:
- Local: http://localhost:xxxx/
- Network: http://ip:xxxx/
```
You can customize the visualization tool in the source code to achieve visual effects that better fit the objectives. To better assist you in achieving personalization of the visualization tool, we recommend following these steps to implement it.
**Step 1: Create your own component**
```vue
## Contribute to our project.
The visualization-tool offers two usage options, which are accessing through the [website](http://39.107.116.221/), or using the source code(for contribution).
**Step 1: Requirements**
```vue
node == 16.14.0
npm == 8.3.1
```
**Step 2: Clone repository and install dependencies**
```Vue
git clone https://github.com/uctb/visualization-tool-UCTB.git
cd visualization-tool-UCTB
npm install
```
**Step 3: Start**
```Vue
npm run serve
```
Then you will see the following prompt on the screen:
```vue
App running at:
- Local: http://localhost:xxxx/
- Network: http://ip:xxxx/
```
You can customize the visualization tool in the source code to achieve visual effects that better fit the objectives. To better assist you in achieving personalization of the visualization tool, we recommend following these steps to implement it.
**Step 1: Create your own component**
```vue
Your own HTML
```
**Step 2: Importing component in App.vue**
```vue
```
More instructions on the usage of Vue can be referred to on the [website](https://v2.vuejs.org/). **If you have any interesting or novel ideas, we highly welcome your pull request:)**