3. Urban Datasets
UCTB is designed for urban computing in various scenarios. Currently, It releases a public dataset repository including bike sharing, ride sharing, traffic speed, and pedestrian counting applications. If you are interested in this project, making a contribution to the dataset is strongly welcomed :)
3.1. Datasets Overview
Currently, UCTB offers the following datasets in 7 scenarios, with detailed information provided in the table below. We are constantly working to release more datasets in the future.
| Application | City | Time Range | Temporal Granularity | Dataset Link |
|---|---|---|---|---|
| Bike-sharing | NYC | 2013.07.01-2017.09.30 | 5 minutes | 66.0M |
| Bike-sharing | Chicago | 2013.07.01-2017.09.30 | 5 minutes | 30.2M |
| Bike-sharing | DC | 2013.07.01-2017.09.30 | 5 minutes | 31.0M |
| Pedestrian Count | Melbourne | 2021.01.01-2022.11.01 | 60 minutes | 1.18M |
| Vehicle Speed | LA | 2012.03.01-2012.06.28 | 5 minutes | 11.8M |
| Vehicle Speed | BAY | 2017.01.01-2017.07.01 | 5 minutes | 27.9M |
| Taxi Demand | Chicago | 2013.01.01-2018.01.01 | 15 minutes | 6.1M |
| Bus | NYC | 2022.02.01-2024.01.13 | 60 mins | 4.89M |
| Metro | NYC | 2022.02.01-2023.12.21 | 60 mins | 11.3M |
| Traffic Flow | Luzern | 2015.01.01-2016.01.01 | 3 mins | 21M |
| Ride-sharing | Chicago (community) | 2013.01.01-2018.01.01 | 15 mins | 6.06 |
| Ride-sharing | Chicago (census tract) | 2013.01.01-2018.01.01 | 15 mins | 10M |
| Ride-sharing | NYC | 2009.01.01-2023.06.01 | 5 mins | 36.9M |
3.2. Bike Datasets
The bike-sharing datasets are collected from U.S. open data portals including New York City (NYC, https://www.citibikenyc.com/system-data), Chicago (CHI, https://www.divvybikes.com/system-data), and DC (https://www.capitalbikeshare.com/system-data). The dataset time span for all three cities is more than four years. The total number of historical flow records is around 49 million, 13 million, and 14 million in NYC, Chicago, and DC, respectively, and each record contains the start station, start time, stop station, stop time, etc.
The following shows the map visualization of bike stations in NYC, Chicago, and DC.
3.3. Bus Datasets
The bus datasets are collected from DATA.NY.GOV: MTA Bus Hourly Ridership. This dataset is provided by the Metropolitan Transportation Authority and is available for public download. It offers bus ridership estimates on an hourly basis by bus route. Data collection started from February 2022 and has been regularly updated. The Bus_NYC dataset includes data up to January 13, 2024. The latest version can be accessed on the website mentioned above. The station info data is downloaded from NYU | Faculty Digital Archive: New York City Bus Routes, Dec 2019. It does not encompass all bus routes. So we discarded the traffic data for bus routes where station information was not found, ultimately retaining 226 bus routes. Following shows the map-visualization of Bus_NYC datasets.

Data catalog: https://github.com/uctb/Urban-Dataset/tree/main/Public_Datasets/Bus
3.4. Speed Datasets
The two traffic speed datasets are widely used in STTP research: METR-LA and PEMS-BAY from Los Angeles (LA) County and Bay Area, respectively. In METR-LA, 207 sensors record highway vehicles’ speeds for four months; In PEMS-BAY, there are 325 sensors for six months. Each sensor can be seen as a station.
Following shows the map-visualization of METR-LA and PEMS-BAY.
3.5. Pedestrian Datasets
The pedestrian datasets are collected from open data website of Melbourne. The full datasets' timespan is over 10 years and the datasets are still being updated at a fixed frequency (i.e., 60 minutes). Due to the fact that some sites were not set up in the early days and some sites lacked data, we only choose about a year in temporal dimension and 55 stations in spatial dimension. There is also accessible information about sensors on the same website. In the dataset of sensor information, we obtain the name, the sensor's ID, the sensor's status(whether it is active or not), the latitude and longtitude of each sensor. Following shows the map-visualization of Pedestrian datasets in Melbourne.

Data catalog: https://github.com/uctb/Urban-Dataset/tree/main/Public_Datasets/Pedestrian
3.6. Taxi Datasets
The Taxi datasets are collected from the city of Chicago's open data portal and the city of New York's open data portal, where you are able to freely download Chicago city's and NYC's datasets for your own analysis. The datasets record taxi trips from these dimensions listed below: pickup and dropoff time, pickup and dropoff location, fee etc. In our dataset, we only consider the pickup info of each record. You can conduct more comprehensive analysis with the help of our datasets and the website.
Taxi Chicago Dataset Facts in dataset description
There are two candidate spatial discretization information: census tract and community area. For each record, it will aggregate census tract granularity into community area due to privacy preserve. Which granularity to choose
Thus, we need to choose a proper granularity. According to the needs of downstream tasks (Spatio-temporal traffic prediction), we summarize two principles of spatial granularity selection:
Spatial granularity as small as possible (especially in high-demand area). Demamd aggregated due to privacy as few as possible. On one hand, time distribution of taxi demand in downtown is dense, and the probability of being aggregated is small. on the other hand, the time distribution of taxi demand in the suburbs is sparse, and the probability of being aggregated is high.
Final datasets we open
We finally choose to process two datasets: one is Taxi_Chicago, where only spatial granularity community area is used; another is Taxi_fine_grained_Chicago, where community area is used in suburbs while census tract is used in downtown.
We highly recommend that you conduct more analysis on Taxi_fine_grained_Chicago. By the way, we have adopted a special operation that taxi demand of specific census tract in 15-minute time window equal or less than 2 will be set 2. This operation won't affect much because all of aggregation situation is ultimately caused by insufficient demand.
Following shows the map-visualization of Taxi_Chicago datasets.

Following shows the map-visualization of Taxi_fine_grained_Chicago datasets.

Taxi NYC Datasets We collect Taxi NYC dataset from these two websites: https://opendata.cityofnewyork.us/ and https://www.nyc.gov/site/tlc/about/tlc-trip-record-data.page. We also obtain information of taxi zones in New York from this website. As a result of size of dataset, we put it on the link with extraction code gw6p.
Following shows the map-visualization of Taxi_NYC datasets.

Data catalog: https://github.com/uctb/Urban-Dataset/tree/main/Public_Datasets/Taxi
3.7. Metro Datasets
The metro datasets are collected from DATA.NY.GOV: MTA Subway Hourly Ridership. The Metro_NYC dataset is provided by the Metropolitan Transportation Authority and is available for public download. It offers estimates of subway ridership on an hourly basis by subway station complex. Data collection started from February 2022 and has been regularly updated. The Metro_NYC dataset includes data up to December 21, 2023. The latest version can be accessed on the website mentioned above.
Following shows the map-visualization of station complex in NYC.

Data catalog: https://github.com/uctb/Urban-Dataset/tree/main/Public_Datasets/Metro
3.8. Flow Speed Datasets
The traffic flow datasets are collected from UTD19 - Research Collection. UTD19 is a large-scale traffic data set from over 20000 stationary detectors on urban roads in 40 cities worldwide making it the largest multi-city traffic data set publically available. In our dataset, we only consider the data for the city of Luzern. The dataset enriched location information of sensors with further attributes describing the location of the sensor with respect to the road network. Following shows the map-visualization of station complex in Luzern.

Data catalog: https://github.com/uctb/Urban-Dataset/tree/main/Public_Datasets/Flow
3.9. Load UCTB Dataset
The pickle module is an external library that comes built-in with Python and provides functionality for converting Python objects into a byte stream (serialization) and restoring them back to their original state (deserialization). We use it to help data format instances to transform between memory and disk.
3.9.1. Dataset format
We've collected some public datasets and processing them into UCTB dataset format. UCTB dataset is a python build-in dictionary object that could be loaded by pickle package. Here is the example of UCTB dataset.
# Let's say ``my_dataset`` is your dataset.
my_dataset = {
    "TimeRange": ['YYYY-MM-DD', 'YYYY-MM-DD'],
    "TimeFitness": 60, # Minutes

    "Node": {
        "TrafficNode": np.array, # With shape [time, num-of-node]
        "TrafficMonthlyInteraction": np.array, # With shape [month, num-of-node. num-of-node]
        "StationInfo": list # elements in it should be [id, build-time, lat, lng, name]
        "POI": []
    },

    "Grid": {
        "TrafficGrid": [],
        "GridLatLng": [],
        "POI": []
    },

    "ExternalFeature": {
         "Weather": [time, weather-feature-dim]
    }
}
3.9.2. Use datasets from Urban Datasets
In this section, we will introduce how to get the dataset from Urban_Dataset and read the dataset using python.
You are proposed to download the zip file from the link and unzip the file. Let's say the following scripts are placed at the same directory with the dataset.
import pickle as pkl
import numpy as np
data_path = 'Pedestrian_Melbourne.pkl'
with open(data_path,'rb') as fp:
    data = pkl.load(fp)
Take a look at the necessary information about the dataset:
# Traffic data
print('Data time range', data['TimeRange'])
print('Traffic data shape:', np.shape(data['Node']['TrafficNode']))
# The first dimension of data['Node']['TrafficNode'] is the length of time-sequence.
# The second dimension is the number of stations.
print('Time fitness:', data['TimeFitness'], 'minutes')
print('Time sequence length:', data['Node']['TrafficNode'].shape[0])
print('Number of stations:', data['Node']['TrafficNode'].shape[1])
Data time range ['2021-01-01', '2022-11-01']
Traffic data shape: (16056, 55)
Time fitness: 60 minutes
Time sequence length: 16056
Number of stations: 55
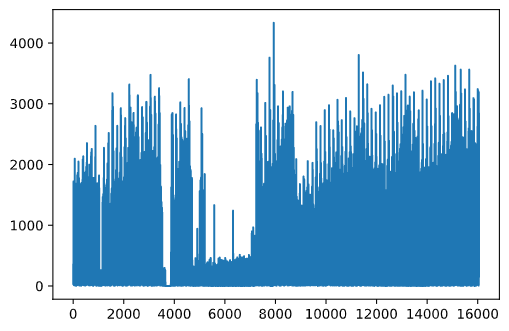
Visualize the distribution of the traffic data:
import matplotlib.pyplot as plt
plt.plot(data['Node']['TrafficNode'][:, 0])
plt.show()
3.10. How to get the datasets at other granularities?
We could merge the fine-grained data to obtain the datasets at other granularities (e.g., by summing the 12 flows from the 5-minutes datasets to obtain 60-minutes datasets). UCTB provides the API to merge data. You could specify MergeIndex and MergeWay in the NodeTrafficLoader and GridTrafficLoader. Here is an example:
from UCTB.dataset import NodeTrafficLoader

# loading 5-minutes datasets

data_loader = NodeTrafficLoader(dataset="Bike", city="NYC")
print(data_loader.dataset.node_traffic.shape) # with shape (446976, 820)

data_loader = NodeTrafficLoader(dataset="Bike", city="NYC", MergeIndex=12, MergeWay="sum")
print(data_loader.dataset.node_traffic.shape) # with shape (37248, 820)
3.11. Build your own datasets
If you want to apply uctb dataloaders to your dataset, make your dataset compatible with the template as section 3.2.1 shown. And then save it with package pickle to a local path pkl_file_name.
import pickle
pkl_file_name = './my_dataset.pkl'
with open(pkl_file_name, 'wb') as handle:
    pickle.dump(my_dataset, handle, protocol=pickle.HIGHEST_PROTOCOL)
Finally, you can make uses of your dataset by UCTB's loader APIs:
data_loader = NodeTrafficLoader(dataset=pkl_file_name)
Also, we provide interface to help build your own dataset, through which we clarify whether a field is necessary or optional when building a UCTB dataset.
To build a UCTB dataset, it is necessary to provide variables listed as below.
| Variable_name | Description |
|---|---|
| time_fitness | The length of the interval between adjacent slots |
| time_range | The time interval at the beginning and end of the data |
| traffic_node | The spatio-temporal information |
| node_satation_info | The basic information of each data collecting node |
| dataset_name | Name of the dataset |
| city | A variable used to integrate holiday and weather information to traffic data |
Then, use the specified path to save the dataset, otherwise it will be saved in the current run-time path.
Although it's diffcult to form an integrated function to include all situation you may meet during the transforming process, there are some procedures you might obey to simplify the data preprocessing.
- Data preprocessing
- Zero values
- Missing values(NA)
- Unknown values
- Abnormal values
- duplicates
- Statistics(station number and time slots)
- Dictionary building
- Basic information(time range and time fitness)
- Traffic node building
- Spatio-temporal raster data building
- Initialization
- iterate raw data table and fill the matrix
- Station information
- Spatio-temporal raster data building
- Traffic grid building
- External feature
Now, we assume that you have already finished variable preparation. UCTB provide API to assist you with dataset building.
build_uctb_dataset(traffic_node=traffic_node, time_fitness=time_fitness,
                node_station_info=node_station_info, time_range=time_range,
                output_dir='tmp_dir', dataset_name='dataset', city = 'Chicago')
Also, if you want to check what fields are in your datasets, set the argument print_dataset to True.
build_uctb_dataset(traffic_node=traffic_node, time_fitness=time_fitness,
                node_station_info=node_station_info, time_range=time_range,
                output_dir='tmp_dir', dataset_name='dataset', city = 'Chicago', print_dataset=True)
Output:
dataset[TimeRange]:<class 'list'>  (len=2)
dataset[TimeFitness]:<class 'int'>
dataset[Node]:<class 'dict'>{
    dataset[Node][TrafficNode]:<class 'numpy.ndarray'>  (shape=(37248, 532))
    dataset[Node][StationInfo]:<class 'list'>  (len=(532, 5))
    dataset[Node][TrafficMonthlyInteraction]:<class 'NoneType'>
}
dataset[Grid]:<class 'dict'>{
    dataset[Grid][TrafficGrid]:<class 'NoneType'>
    dataset[Grid][GridLatLng]:<class 'NoneType'>
}
dataset[ExternalFeature]:<class 'dict'>{
    dataset[ExternalFeature][Weather]:<class 'list'>  (len=0)
}
dataset[LenTimeSlots]:<class 'int'>
What's more, if you want to integrate additional information of the dataset, just specify the optional argument as bellow.
| Variable_name | Description |
|---|---|
| traffic_monthly_interaction | The interactive information among data collecting nodes. |
| node_poi | Point of interests conformed with node format |
| grid_poi | Point of interests conformed with grid format |
| traffic_grid | The spatio-temporal information in grid format. |
| gird_lat_lng | The basic information of each data collecting grid. |
| external_feature_weather | The weather information of each day. |
for example, specify the argument external_feature_weather with numpy.array object.
build_uctb_dataset(traffic_node=traffic_node, time_fitness=time_fitness,
                node_station_info=node_station_info, time_range=time_range,
                output_dir='tmp_dir', dataset_name='dataset', city = 'Chicago',
                print_dataset=True, external_feature_weather=np.zeros([37248,26]))
The code above use zero matrix to specify the argument external_feature_weather. While in practical application scenario, you should substitute it with real feather matrix. The first dimension of the matrx is the number of time slots, and the second dimension corresponds to the dimension of weather features.